
Quick Answer
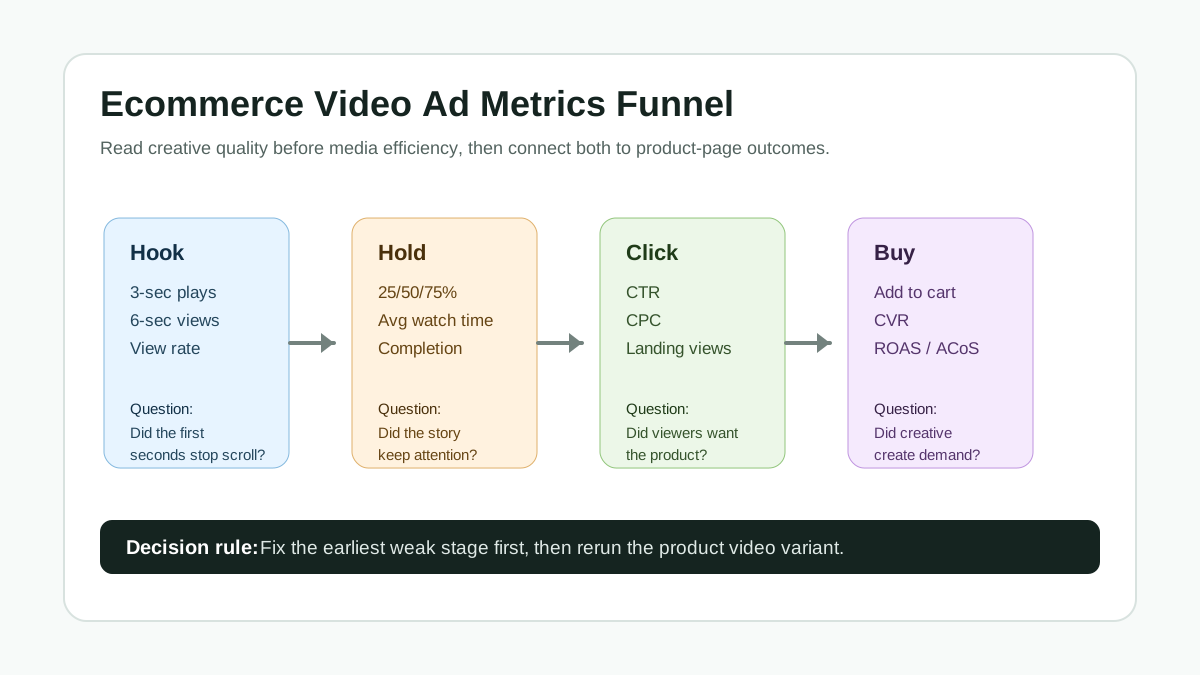
The video ad metrics that matter most for ecommerce product videos are not just views or ROAS. Read them in sequence: impressions and reach show delivery, early view metrics show whether the hook stops the scroll, quartile or watch-time metrics show whether the product story holds attention, CTR and landing page views show whether viewers want the offer, and conversion metrics show whether the video, audience, and product page work together. Fix the earliest weak stage before you make a bigger budget decision.
That sequence matters because a product video can fail in several different places. A low 3-second or 6-second view rate usually points to the hook, thumbnail, opening frame, or first caption. Good watch time with weak CTR points to a video that entertains but does not sell. Strong CTR with weak purchase rate often means the ad promise, price, shipping, product page, or tracking setup needs review.
Why Video Ad Metrics Need a Creative Workflow
Most ad dashboards are designed around media buying. They tell you what happened after spend was delivered: impressions, clicks, costs, conversions, ROAS, ACoS, and audience reach. Those numbers are necessary, but ecommerce teams also need to turn the report into a creative production decision.
For example, "low ROAS" is not a useful edit note. It could mean the first two seconds are weak, the product benefit is unclear, the price is too late, the landing page contradicts the ad, or the audience has already seen the same creative too many times. The better question is: where does the metric pattern first break?
Use this order when reviewing a product video ad:
- Delivery: Did the ad receive enough impressions for a fair read?
- Hook: Did people stop long enough to understand the product?
- Hold: Did they keep watching through the proof and offer?
- Click: Did the ad create enough intent to visit the page?
- Product action: Did visitors add to cart, purchase, or move to the next step?
- Efficiency: Did the result make sense after spend, margin, and attribution lag?
If you use ShopShot to create variants from product images, scripts, and product-page inputs, this sequence also gives you a clean production brief. Instead of asking for "a better video," ask for a new opening visual, a stronger proof shot, a shorter version, a clearer CTA, or a platform-specific cut. For a broader testing structure, pair this guide with the ecommerce video ad testing plan.
The Core Video Ad Metrics to Track
Every platform names metrics differently, but ecommerce product video reports usually fall into the same funnel.
| Metric group | What it tells you | Common fields | Creative decision |
|---|---|---|---|
| Delivery | Whether the ad entered auctions and reached people | Impressions, reach, frequency, spend | Do not judge creative until delivery is meaningful |
| Early attention | Whether the opening frame and hook worked | 2-second, 3-second, 5-second, or 6-second views; view rate | Rewrite the first visual, first line, or thumbnail |
| Retention | Whether the product story held attention | Average watch time, video played to 25/50/75/100%, completion rate | Shorten, reorder proof, remove slow setup |
| Click intent | Whether viewers wanted the product or offer | CTR, outbound clicks, destination clicks, CPC | Add offer clarity, product proof, price cue, CTA |
| Page action | Whether the traffic behaved after the click | Landing page views, add to cart, checkout, purchase, CVR | Align PDP, shipping, price, and claim |
| Efficiency | Whether the spend is commercially viable | CPA, ROAS, ACoS, new-to-brand metrics | Scale, pause, or produce a new angle |
The most common mistake is reading the last row first. ROAS matters, but it is a summary metric. It does not tell you which scene to change. Creative teams need the earlier diagnostic metrics because those metrics show where attention, comprehension, or intent fell apart.
Platform Metric Map for Ecommerce Product Videos
TikTok Ads
TikTok reporting includes core fields such as impressions, reach, frequency, clicks, conversions, conversion rate, cost, cost per conversion, and CPC. For ecommerce video creative, use these as a funnel rather than a flat dashboard.
| TikTok metric | Ecommerce reading | Possible creative fix |
|---|---|---|
| Impressions and reach | The ad entered delivery and reached enough people to evaluate | Wait for enough delivery before judging |
| Frequency | The same audience may be seeing the video too often | Refresh hook, avatar, overlay, or offer |
| Clicks destination | People clicked toward the intended page | Compare to product-page actions |
| Conversion rate by impressions or clicks | Whether the ad and page are converting | Check offer, PDP trust signals, checkout friction |
| Cost per conversion | Whether the result is affordable | Test new creative before only raising budget |
For TikTok Shop or product-led TikTok ads, separate entertainment from buying intent. A video can earn likes and comments without creating profitable traffic. If engagement is strong but destination clicks are weak, the next version should show the product earlier, include a direct use case, or make the offer more concrete. For a production checklist specific to the platform, use the TikTok Shop product video checklist and link your campaign workflow back to the live TikTok Shop tool page.
Meta Ads
Meta video reports can include video plays, ThruPlays, average play time, and milestone metrics such as plays at 25%, 50%, 75%, 95%, and 100%. Some Meta help pages require login in certain browsers, so verify the fields inside your own Ads Manager account before building a recurring report.
Use Meta's video milestones as a creative drop-off curve:
| Meta pattern | Likely issue | Next video variant |
|---|---|---|
| Low 3-second plays | Opening frame does not stop the feed | Start with product result, surprising use case, or bold problem |
| Good 3-second plays, weak 25% or 50% | Hook works, middle is slow or unclear | Move proof earlier and cut setup |
| Good retention, weak CTR | Interesting story, weak product intent | Add offer, price range, social proof, CTA, or product close-up |
| Strong clicks, weak add-to-cart | Landing page mismatch or product friction | Match headline, product image, offer, shipping, and reviews |
Meta placement mix can also hide creative issues. A product video may look strong in Reels but weak in Feed, or strong in Feed but unreadable in Stories. When placement performance differs, do not average everything into one "winner." Export separate cuts and check safe-zone constraints with the product video aspect ratio guide and the live Facebook ads tool page.
Google Ads and YouTube
Google Ads separates video formats, view definitions, and engagement rules. YouTube ad metrics include impressions, TrueView views, engagements, view rate, "video played to" milestones, earned actions, and viewability. Google also notes that, as of October 2025, the Views metric is called TrueView views in Google Ads reporting.
This matters because a view is not the same thing across every format. For example, skippable in-stream, in-feed, and Shorts ads each have different conditions for counting a view or engagement. When comparing videos, use the same format, goal, audience, and date range wherever possible.
| Google/YouTube metric | What to inspect | Creative action |
|---|---|---|
| TrueView view rate | How many impressions became counted views | Test the hook and first scene |
| Video played to 25/50/75/100% | Where viewers leave | Shorten or reorder the product proof |
| Engagements | Whether viewers watched or interacted beyond a shallow impression | Improve middle section and CTA |
| Earned actions | Whether paid viewing created follow-on channel actions | Use for brand learning, not direct ROAS alone |
| Clicks and conversions | Whether attention became product interest | Align offer and landing page |
If you are exporting product videos for YouTube Shorts, in-stream, and in-feed placements, review the Google Ads video specs for ecommerce before interpreting performance. Bad format fit can look like bad creative.
Amazon Sponsored Brands Video
Amazon Sponsored Brands video ads sit close to shopping intent, so the report should connect creative attention to product detail page behavior and sales efficiency. Amazon's own guidance says measurement should start with the campaign goal: impressions and top-of-search impression share for awareness, click-through rate for consideration, and new-to-brand metrics, ACoS, ROAS, and 14-day attributed sales for conversion-focused analysis.
That makes Amazon different from a social feed. A viewer may already be searching for a product category. Your product video must make the item understandable quickly: what it is, who it is for, why it is better, and what action the shopper should take. Amazon also notes that Sponsored Brands video playback starts muted by default and that the video plays automatically when 50% of pixels are on-screen, so visual clarity matters before sound.
For Amazon-focused creative, treat these as the main edit notes:
| Amazon signal | What it can mean | Product video edit |
|---|---|---|
| Low top-of-search impression share | Media competitiveness, targeting, or budget issue | Do not rewrite creative before checking delivery |
| Impressions but weak CTR | The thumbnail/opening frame or product value is unclear | Show product benefit in the first seconds |
| Strong CTR but weak sales | PDP, price, reviews, or offer may be weak | Align product page proof with the ad promise |
| High ACoS | Spend is too high relative to attributed sales | Test a tighter product-use-case angle |
For acceptance and specs, Amazon Sponsored Brands video has its own duration, file, codec, safe-area, and policy requirements. Use the Amazon product video requirements and Amazon tool page when preparing platform-specific versions.
A Practical Diagnosis Matrix
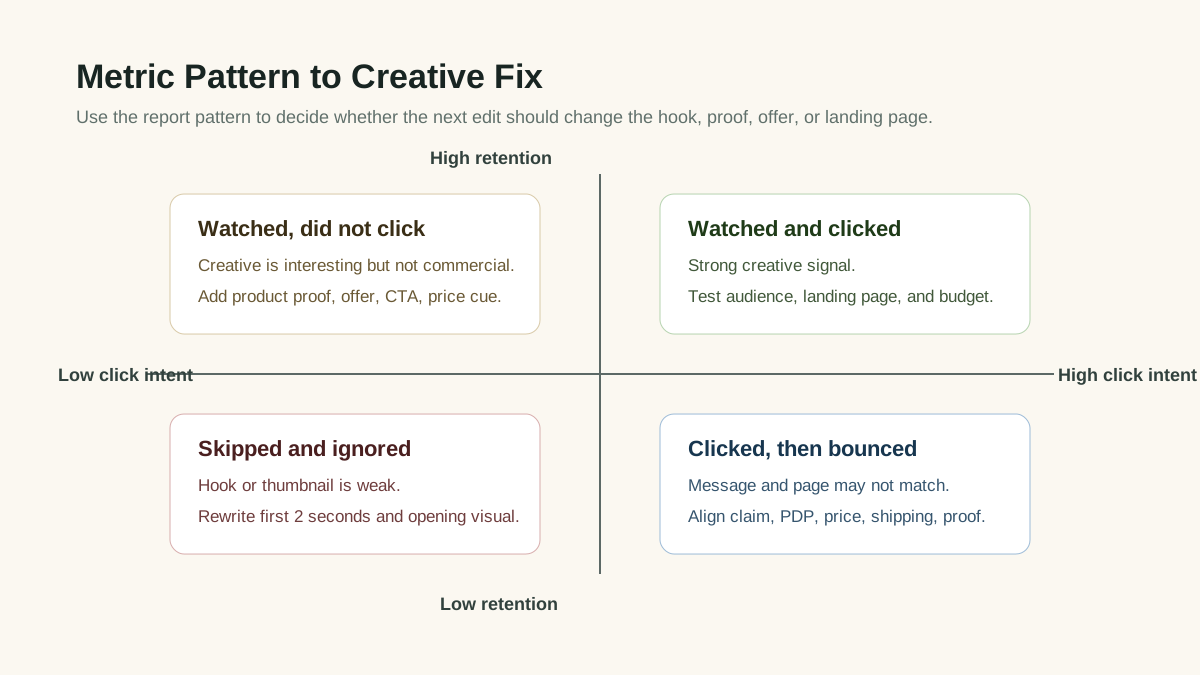
The fastest way to turn reporting into action is to map each metric pattern to the next creative revision.
| Metric pattern | Diagnosis | First revision to make | Do not do first |
|---|---|---|---|
| Low impressions, low spend | Delivery problem, not enough data | Check audience, bid, budget, rejection, and campaign status | Rewrite every scene |
| High impressions, low early views | Hook or opening visual failed | Change first frame, first caption, and first product shot | Increase budget |
| Good early views, steep 25-50% drop | Setup is too slow or confusing | Move benefit, demo, or proof into seconds 3-7 | Add more background |
| Good retention, low CTR | The video is watchable but not persuasive | Add offer, CTA, use case, price cue, or product comparison | Celebrate views as success |
| Good CTR, low landing page views | Click quality, page load, or tracking issue | Check page speed, UTMs, pixel events, and mobile rendering | Blame the video only |
| Good traffic, low add to cart | Product page mismatch | Match claim, headline, hero image, reviews, and shipping details | Produce more ads before fixing PDP |
| Good CPA, rising frequency | Creative fatigue may be starting | Rotate hooks and visual angles | Pause the whole campaign |
| Good ROAS, weak new customer rate | Retargeting is doing the work | Build prospecting-specific proof and problem angles | Assume the video scales unchanged |
This matrix is also a strong way to brief new ShopShot variants. If the issue is early attention, generate a version with a new opening image and headline. If retention is weak, generate a shorter sequence with the product proof moved earlier. If CTR is weak, create a version that makes the offer explicit and uses a stronger product close-up.
How to Review a Product Video Ad Report in 20 Minutes
Step 1: Confirm the campaign goal and attribution window
Do not compare an awareness campaign to a sales campaign as if they are the same test. A video optimized for reach may produce cheaper impressions and weaker conversion data. A conversion campaign may spend slowly if the audience is narrow or the event signal is limited.
Record the goal, optimization event, date range, attribution window, placement mix, and audience. Without this context, the same metric can lead to the wrong edit.
Step 2: Check delivery before judging creative
Look at spend, impressions, reach, frequency, rejection status, and placement delivery. If the ad barely delivered, there is not enough evidence to make a creative call. If frequency is already high, weak results may be fatigue rather than a bad concept.
Step 3: Read the first attention metric
Find the earliest available attention metric for the platform: 2-second continuous plays, 3-second plays, 5-second views, 6-second views, TrueView view rate, or the closest equivalent in your report. If this stage is weak, change the opening frame before you change the offer.
Strong product-video openings usually show one of four things:
- The product solving a visible problem.
- The finished result before the explanation.
- A sharp comparison between old way and new way.
- A product detail that creates curiosity.
Step 4: Read retention and drop-off
Watch-time milestones tell you where the story loses people. If the drop happens early, the concept is unclear. If the drop happens after the product reveal, the proof may be too slow. If the drop happens before the CTA, the video may need a shorter cut.
This is where the product video length guide is useful. A 35-second story may work for a PDP or retargeting audience, while a cold social ad may need a faster 12-20 second version.
Step 5: Compare click intent to page behavior
CTR, destination clicks, and landing page views tell you whether the ad created enough intent to leave the feed. But clicks alone can mislead you. If clicks are strong and landing page views are weak, check page speed, accidental taps, UTMs, tracking, and mobile layout. If landing page views are strong and purchases are weak, inspect the product page.
Ask these questions:
- Does the page repeat the same product benefit promised in the video?
- Is the exact product visible above the fold?
- Are price, shipping, returns, and reviews easy to find?
- Does the product page support the proof used in the video?
- Is the CTA consistent with the ad CTA?
Step 6: Decide whether to scale, revise, or stop
Do not make a binary decision based on one number. Use a three-way decision:
| Decision | Use when | Next step |
|---|---|---|
| Scale | Hook, retention, CTR, and conversion economics all look healthy | Increase budget gradually and monitor frequency |
| Revise | One stage is clearly weak but the offer is still relevant | Produce a focused variant for that stage |
| Stop | Multiple stages fail after fair delivery and the product angle is weak | Test a different angle, audience, or product |
For retargeting campaigns, use a stricter message-match check. Retargeting audiences may already know the product, so the creative should address hesitation: proof, objections, bundles, delivery timing, or limited-time offer. The product video retargeting ads guide covers that sequence in more detail.
What Good Reporting Looks Like
A useful weekly product video report should fit on one page. It should not be a dump of every metric in the platform.
| Report section | Include | Why it matters |
|---|---|---|
| Campaign context | Goal, audience, placement, date range, spend | Prevents false comparisons |
| Creative snapshot | Thumbnail, first frame, hook, offer, CTA | Connects metrics to the actual video |
| Attention | Early views and view rate | Diagnoses the opening |
| Retention | Watch time or quartile drop-off | Diagnoses pacing and proof |
| Intent | CTR, destination clicks, CPC | Diagnoses commercial interest |
| Page outcome | Landing page views, add to cart, purchase, CVR | Diagnoses page and offer match |
| Efficiency | CPA, ROAS, ACoS, margin-adjusted result | Determines business viability |
| Next edit | One specific creative change | Keeps production focused |
The "next edit" is the most important line. If the report does not produce a production instruction, it is not finished.
Common Mistakes When Reading Video Ad Metrics
Treating views as the main success metric
Views can show attention, but they do not prove buying intent. A product video with fewer views but stronger CTR, add-to-cart rate, and margin-adjusted ROAS may be the better ad.
Comparing unlike formats
Do not compare Shorts, Reels, in-stream, Stories, Feed, and Amazon search video as if their metrics are identical. The view definition, placement behavior, sound state, and user intent differ. Compare variants within the same platform and placement before declaring a creative winner.
Ignoring creative fatigue
Frequency changes interpretation. If performance declines after repeated exposure, the concept may still be valid but the audience has seen it too often. Refresh the hook, visual angle, CTA, or proof point before discarding the whole message.
Fixing the landing page with more videos
If CTR is strong but add-to-cart or purchase rate is weak, another video may not solve the problem. Review product page message match first. Ecommerce product videos work best when the ad and page feel like one continuous promise.
Reporting averages without segmenting
A blended ROAS number can hide that one placement, one audience, or one format is carrying the campaign. Segment by placement, audience, creative, and date range before deciding which video to scale.
ShopShot Workflow: Turn Metrics Into the Next Variant
ShopShot is most useful when the creative brief is specific. Instead of creating random variants, use the failed metric stage as the input.
| Failed stage | ShopShot production brief |
|---|---|
| Early attention | "Create a 15-second product video that opens with the finished result and a direct problem statement." |
| Retention | "Move the product demo to second 3, cut setup, and show one proof point before the CTA." |
| CTR | "Add price cue, offer text, product close-up, and a direct shop-now CTA." |
| Page action | "Match the product page headline and hero image, then produce a variant that repeats the same claim." |
| Fatigue | "Keep the offer but generate three new hooks with different opening visuals." |
For teams building product video ads from images, start with the AI video generator, then use reporting to create the next specific variation. The goal is not more videos for its own sake. The goal is a cleaner loop: metric pattern, creative diagnosis, focused revision, retest.
FAQ
What is the most important video ad metric for ecommerce?
There is no single metric that works in every campaign. For creative diagnosis, start with early attention and retention metrics. For business decisions, connect those metrics to CTR, conversion rate, CPA, ROAS, ACoS, and margin.
How many impressions do I need before judging a product video ad?
There is no universal number because audience size, platform, budget, and optimization goal differ. At minimum, wait until the ad has enough delivery to show a stable pattern across attention, retention, click, and conversion metrics. If impressions are very low, solve delivery first.
Why does a product video get good views but no sales?
The video may be entertaining without creating product intent, or the page may not match the ad promise. Check CTR, landing page views, add-to-cart rate, product page speed, price visibility, reviews, shipping, and offer clarity before producing more variants.
Should I optimize for watch time or purchases?
Use the campaign goal as the tie-breaker. Watch time is useful for diagnosing creative quality, especially hooks and pacing. Purchases, CPA, ROAS, and margin decide whether the campaign is commercially viable.
How should I compare TikTok, Meta, Google, and Amazon video metrics?
Compare the funnel stage, not the field name. TikTok, Meta, Google, and Amazon use different definitions for views, engagements, placements, and attributed sales. Map each platform's fields to delivery, attention, retention, click intent, page action, and efficiency.
Conclusion
Good video ad reporting should make the next creative decision obvious. Start with delivery, read the earliest attention metric, inspect retention, compare click intent to product-page behavior, then judge efficiency. When a stage breaks, revise that stage first.
For ecommerce teams, this keeps product video production practical. A weak hook needs a new opening. Weak retention needs a tighter story. Weak CTR needs a stronger product reason to click. Weak purchase rate needs page and offer alignment. Use the metrics to write the next brief, then generate a focused ShopShot variant instead of guessing.
Sources Checked
- Google Ads Help: About YouTube ads and view metrics
- Google Ads Help: About video ad formats
- TikTok Ads Manager: Basic metrics and definitions
- Meta Business Help: About video metrics for ads
- Amazon Ads: Getting started with Sponsored Brands video
- Amazon Ads: Sponsored Brands video specs and guidelines